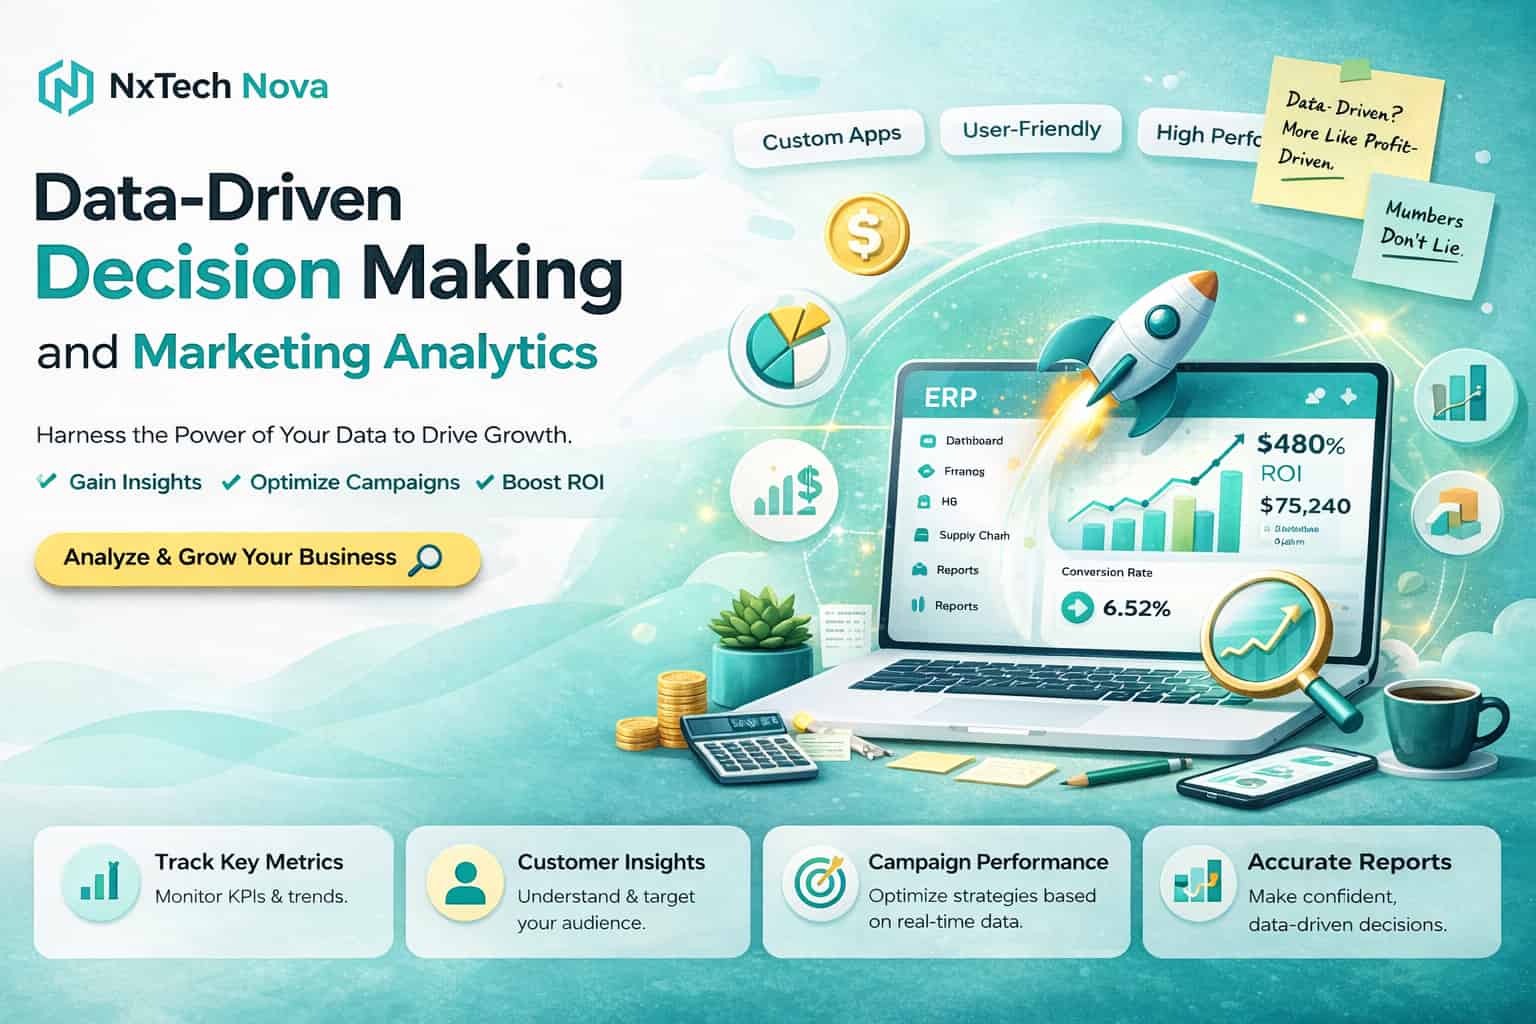
Data-driven decision making and marketing analytics
One dashboard says traffic is up. Another says leads are flat. Paid ads look expensive. Organic search looks healthy. Social media feels busy, yet revenue does not reflect the effort. Everyone has data, but nobody feels fully confident about what to do next.
That is the real problem most brands face today. The issue is not a lack of data. It is the gap between having numbers and making decisions from those numbers.
This blog is built to close that gap.
A lot of articles on marketing analytics explain tools in isolation. Some focus only on AI trends. Some only explain Google Analytics. Others list SEO metrics without showing how those numbers connect to business decisions. Public guides on these topics often treat them as separate conversations, even though modern brands need them working together.
In the sections below, we will connect the full picture in a practical way.
-
What AI actually changes in marketing decision making
-
How AI improves reporting and data analysis
-
How to use Google Analytics properly in 2026
-
Why Google Analytics matters for both SEO and PPC
-
Which SEO metrics deserve attention and which ones do not
-
How to turn metrics into better strategy instead of prettier reports
If you are a founder, marketing manager, in house SEO lead, or business owner comparing partners in London, Toronto, Dubai, Sydney, or anywhere else, the same rule applies. The best marketing strategy is the one you can measure, interpret, and improve with confidence.
What role does AI play in data-driven decision-making for brands?
AI changes data driven decision making by helping brands move faster from information to action.
That sounds simple, but the shift is bigger than it looks. Traditional reporting tells you what happened. AI helps you notice patterns, flag anomalies, forecast outcomes, summarize large datasets, and suggest the next step before your team spends hours digging through spreadsheets. Research on AI powered marketing shows it is now used across multiple marketing functions, not just for content generation, but also for analysis, segmentation, optimization, and strategic support. Recent business research also shows decision making in sales and marketing is moving toward faster, more context aware responses driven by real time data and AI support.
For brands, this means AI is no longer just a tool for creating ad copy or social posts. It becomes a decision layer.
Think of it in five practical roles.
- AI helps collect signal from scattered sources
Most brands store useful insight across Google Analytics, Search Console, ad platforms, CRM systems, email tools, and sales records. AI helps connect those sources so your team can see one story instead of six disconnected reports.
- AI spots patterns humans miss
A human can review campaign data. AI can review thousands of rows, find conversion patterns by device, source, landing page, time of day, and audience segment, then highlight which combinations actually lead to revenue.
- AI helps with prediction
Instead of asking only what happened last month, brands can ask what is likely to happen next if they increase budget, improve page speed, refresh a landing page, or shift spend from one channel to another.
- AI makes reporting useful
A good AI reporting setup does not just display charts. It explains what changed, why it changed, and what deserves attention first.
- AI shortens the time between insight and execution
This is where data driven marketing becomes real. If a page has growing impressions but weak click through rate, AI can flag that opportunity fast. If paid search is bringing traffic but weak engagement, AI can identify the landing page mismatch. If email is converting better than expected for returning users, AI can push that insight to the team before the week ends.
The key point is this. AI should not replace strategy. It should sharpen it.
Brands still need humans to define goals, choose priorities, understand customers, and make judgment calls that depend on context. AI is most valuable when it handles scale, speed, pattern recognition, and first pass analysis, while people handle positioning, brand voice, customer empathy, and commercial decisions.
That is also where many businesses go wrong. They adopt AI for output, but not for decision quality. They use it to produce more content, more reports, and more dashboards, while the real need is better prioritization.
A healthier approach is to ask four questions every time AI enters your marketing stack.
-
What data is it reading
-
What question is it helping answer
-
What action should follow the insight
-
How will we measure whether that action worked
If your team cannot answer those four questions, you are not really using AI for data driven decision making. You are just automating noise.
In 2026, the strongest brands are not the ones with the most tools. They are the ones with the clearest measurement system and the discipline to act on what the data actually says. Google’s own 2026 marketing guidance points to major shifts in AI, customer behavior, and the ways people search, stream, scroll, and shop, which makes adaptive measurement even more important.
And when a business wants help building that system properly, this is often the point where they start looking for an ai marketing agency near me that can connect analytics, content, SEO, PPC, and automation into one measurable strategy.
How can AI help with digital marketing data analysis and reporting?
The biggest reporting problem in digital marketing is not data scarcity. It is reporting fatigue.
Teams pull numbers from multiple channels, copy them into slides, highlight a few wins, and still finish the week unsure of what matters most. AI improves this by turning reporting from a manual task into a decision support process.
Here is where AI helps most in day to day analysis.
It turns raw numbers into readable insights
A proper AI assisted reporting setup can summarize changes in traffic, conversions, engagement, and channel performance in plain language. That matters because executives rarely need thirty tabs of data. They need a clear answer to questions like these.
-
What changed this week
-
Which channel improved
-
Which page underperformed
-
Where are we losing money
-
What should we fix first
It improves anomaly detection
One of the most useful jobs AI can do is detect unusual changes early.
For example, if paid search cost rises but key events do not improve, AI can flag that pattern. If organic traffic drops only on mobile landing pages, that can surface quickly. If a location page suddenly gains impressions but has low CTR, AI can bring it to the team before the opportunity cools off.
It helps connect performance to causes
Good reporting answers two levels of questions.
The first level is descriptive. What happened?
The second level is diagnostic. Why did it happen?
AI is strong at the second level because it can compare multiple dimensions at once. It can show that conversions dipped not because traffic fell overall, but because one high intent campaign sent users to a slower page, or because returning users converted while first time visitors did not.
It makes attribution less confusing
Modern marketing journeys are messy. A customer might first discover your brand through search, come back through an ad, read a blog, join your email list, and convert days later. AI can help organize those journeys and highlight the assisted value of channels that often get ignored when teams only look at last click reporting.
It saves time on repeat analysis
Some reports repeat every week. Channel performance, landing page performance, campaign summaries, lead quality, search query movements, branded versus non branded demand, and conversion shifts all follow a repeating pattern. These are perfect for automation.
Once your reporting starts eating hours every week, a clean business automation workflow is often more useful than adding another dashboard. The goal is not to automate for the sake of automation. The goal is to free your team to spend more time on strategy, testing, and customer insight.
A simple AI reporting framework that actually works
If you want AI reporting to help rather than overwhelm, keep the workflow simple.
-
Collect data from the right placesStart with Google Analytics, Search Console, Google Ads, CRM data, and your key landing pages.
-
Define decision metricsChoose the numbers that matter for actual outcomes, not just activity. That usually means qualified traffic, engaged sessions, key events, lead quality, cost per acquisition, and revenue by channel.
-
Build automated summariesLet AI generate a weekly or daily performance narrative that explains major changes.
-
Add anomaly alertsGet notified when traffic, conversions, CTR, or cost moves beyond normal range.
-
Review with human judgmentNever let the summary become the strategy. Use the summary to start the conversation, not end it.
This is the point where data driven marketing automation becomes practical. You are no longer manually chasing numbers. You are building a system that surfaces insight, supports decisions, and creates a repeatable rhythm.
That rhythm matters because reporting is not just about looking backward. It should help your brand choose where to invest next. If your team is trying to connect reporting, paid media, content, and analytics under one plan, this is often where digital marketing consulting near me becomes relevant, not as a sales move, but as a way to build a measurement system that the whole team can trust.
How to use Google Analytics to track your marketing success in 2026?
In 2026, using Google Analytics well means using it as a decision system, not just a traffic counter.
Google Analytics is built to collect website and app data together, uses an event based model rather than the old session first model, includes privacy related measurement features, and offers predictive capabilities plus direct integrations with media platforms. That architecture is one of the reasons it remains central to modern marketing measurement.
Here is the practical way to use it.
1. Start with the business question, not the dashboard
Before opening any report, decide what success means.
For one business, success is booked demos. For another, it is qualified ecommerce revenue. For a service brand, it may be calls, form submissions, or location specific leads. Your analytics setup only becomes useful when it is tied to a business outcome.
Write down your core success actions first.
-
Lead form completed
-
Phone call from website
-
Product purchase
-
Add to cart
-
Consultation booking
-
Newsletter signup
-
Download of a sales asset
These actions should become your important events.
2. Mark the right events as key events
Google Analytics now uses the term key events for what were previously called conversions. Google states that key events are created and reported in the same way legacy conversions were, which means you should still mark the events that are most important to your business.
This matters because many accounts still track too many low value actions and too few meaningful ones. If every click is treated like success, the data becomes noisy fast.
A cleaner setup usually includes a short list of primary key events and a separate list of supporting events.
3. Choose the right Reports snapshot view
Google’s Reports snapshot now lets users choose templates such as User behavior, Sales and revenue, and Marketing performance, then customize the cards and metrics shown. That is useful because different businesses need different at a glance views.
If your goal is marketing performance, build the snapshot around:
-
Users and sessions
-
Engaged sessions
-
Key events
-
Traffic by channel
-
Landing page performance
-
Revenue or lead value
-
Campaign level movement
This turns the home screen into a useful decision page instead of a generic overview.
4. Use acquisition reports the right way
One of the biggest mistakes marketers make is mixing up user acquisition and traffic acquisition.
Google explains that the User acquisition report shows how new users first found your site, while the Traffic acquisition report focuses on where sessions came from, including new and returning users. The reports are related, but they answer different questions.
Use them like this.
-
User acquisition tells you which channels introduce your brand best
-
Traffic acquisition tells you which channels continue driving visits and engagement
-
Comparing both can reveal whether a channel is good at discovery, good at retention, or strong at both
That distinction is especially useful when evaluating SEO, paid search, email, and remarketing together.
5. Pay attention to engagement, not just visits
Google defines engagement rate through engaged sessions. A session counts as engaged when it lasts longer than 10 seconds, has a key event, or includes at least two page or screen views.
That is a better quality signal than raw traffic alone.
If paid search brings volume but low engagement, something is off. If organic search brings fewer visits but higher engagement and stronger key event completion, that traffic may be more valuable than the channel report first suggests.
6. Connect Google Analytics with Google Ads and conversion data
This is one of the highest value steps in the whole setup.
Google Ads documentation says that customers linking Google Ads or Google Marketing Platform with Analytics are correlated with a 23 percent increase in conversions and a 10 percent reduction in cost per conversion. Google also notes 2026 changes to enhanced conversions, including acceptance of user provided data from website tags, Data Manager, and API connections starting in April 2026, with enhanced conversions for web and leads combined into one feature in June 2026.
In practical terms, that means your tracking stack should be built for better conversion accuracy, better bidding, and cleaner cross channel insight.
7. Review landing pages by source, not just overall
Do not ask only which page got the most visits.
Ask:
-
Which landing pages attract organic search traffic
-
Which landing pages attract paid search traffic
-
Which pages keep people engaged
-
Which pages lead to key events
-
Which pages attract visits but fail to convert
This is where the marketing team often finds the biggest hidden opportunities. Sometimes the problem is not the campaign. It is the page.
8. Build a weekly decision rhythm
The best Google Analytics setups are simple enough to review consistently.
A good weekly routine looks like this.
-
Check traffic acquisition for channel movement
-
Review landing pages with strong traffic but weak key events
-
Compare organic and paid channel quality
-
Look for unexpected changes in engagement rate
-
Review campaign and audience performance
-
Make one or two concrete changes based on the data
That last part matters most. Analytics creates value only when it changes action.
What is Google Analytics and why is it useful for SEO and PPC?
Google Analytics is a reporting and measurement platform that helps you understand how users arrive, behave, and convert on your website or app. Google’s official documentation describes it as a system that collects data from websites and apps to create reports that help businesses monitor traffic, investigate data, and understand users and their activity.
For marketers, that makes it one of the central tools in the stack.
But it becomes even more useful when you understand what it does for SEO and PPC specifically.
Why it matters for SEO
SEO is not just about rankings. It is about attracting the right visits and turning those visits into meaningful business outcomes.
Google Analytics helps SEO by showing:
-
Which landing pages attract organic users
-
How those users behave after landing
-
Which pages generate engaged sessions
-
Which organic visits complete key events
-
Which blog, service, or category pages deserve expansion
Search Console tells you how your site appears in Google Search. It reports clicks, impressions, CTR, and average position, and lets you group data by page, query, country, and device. Search Console is also the platform Google describes as helping you monitor, maintain, and troubleshoot your site’s presence in Search.
That means Search Console tells you how visible you are in search, while Google Analytics helps show what happens after the click.
You need both.
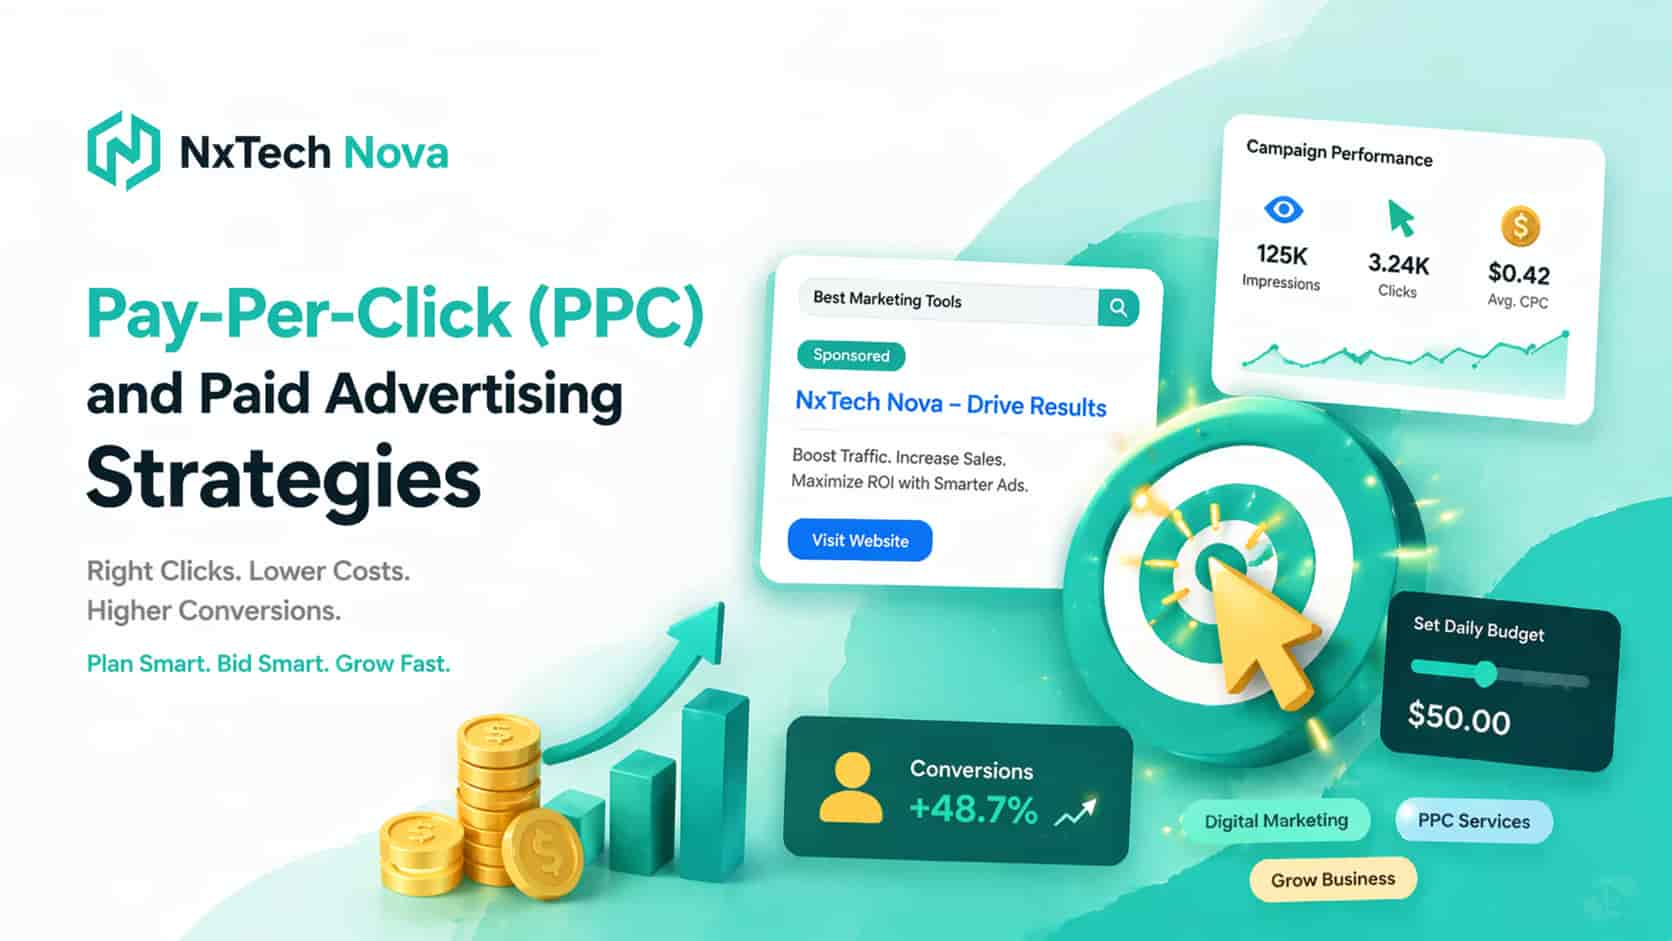
Why it matters for PPC
PPC teams often live inside ad platforms, but ad platforms do not tell the full story on site behavior.
Google Analytics helps PPC teams see:
-
Whether paid traffic is actually engaged
-
Which campaigns send quality visits
-
Which landing pages are weak
-
Whether different devices behave differently
-
Whether campaign traffic leads to key events and downstream value
That is why PPC should never be judged on clicks alone. A campaign with expensive clicks can still be profitable if the landing page converts high intent users. A campaign with cheap clicks can still fail if the traffic is unqualified.
Google Ads also defines CTR as clicks divided by impressions. That metric is useful, but it is only an entry signal. You still need Analytics to understand what happened after the click.
If your paid search reports look strong but revenue disagrees, there is a good chance the issue sits in one of these places:
-
Weak offer to audience match
-
Poor landing page experience
-
Slow page load
-
Broken or missing tracking
-
Low quality search terms
-
Weak post click journey
That is why brands often review paid media together with ppc services near me only after checking what Analytics says about on site quality, not just what the ad platform says about spend and clicks.
The real strength comes from using SEO and PPC together
One of the smartest uses of Google Analytics is comparing organic and paid traffic on the same pages.
For example:
-
If PPC converts well on a topic where SEO is weak, that topic may deserve more content and optimization
-
If SEO drives strong engagement on a page but PPC underperforms there, the ad message or keyword match may be wrong
-
If both channels perform well on the same topic, that is a signal to invest harder
This is what data driven decision making looks like in practice. Not more dashboards. Better comparisons.
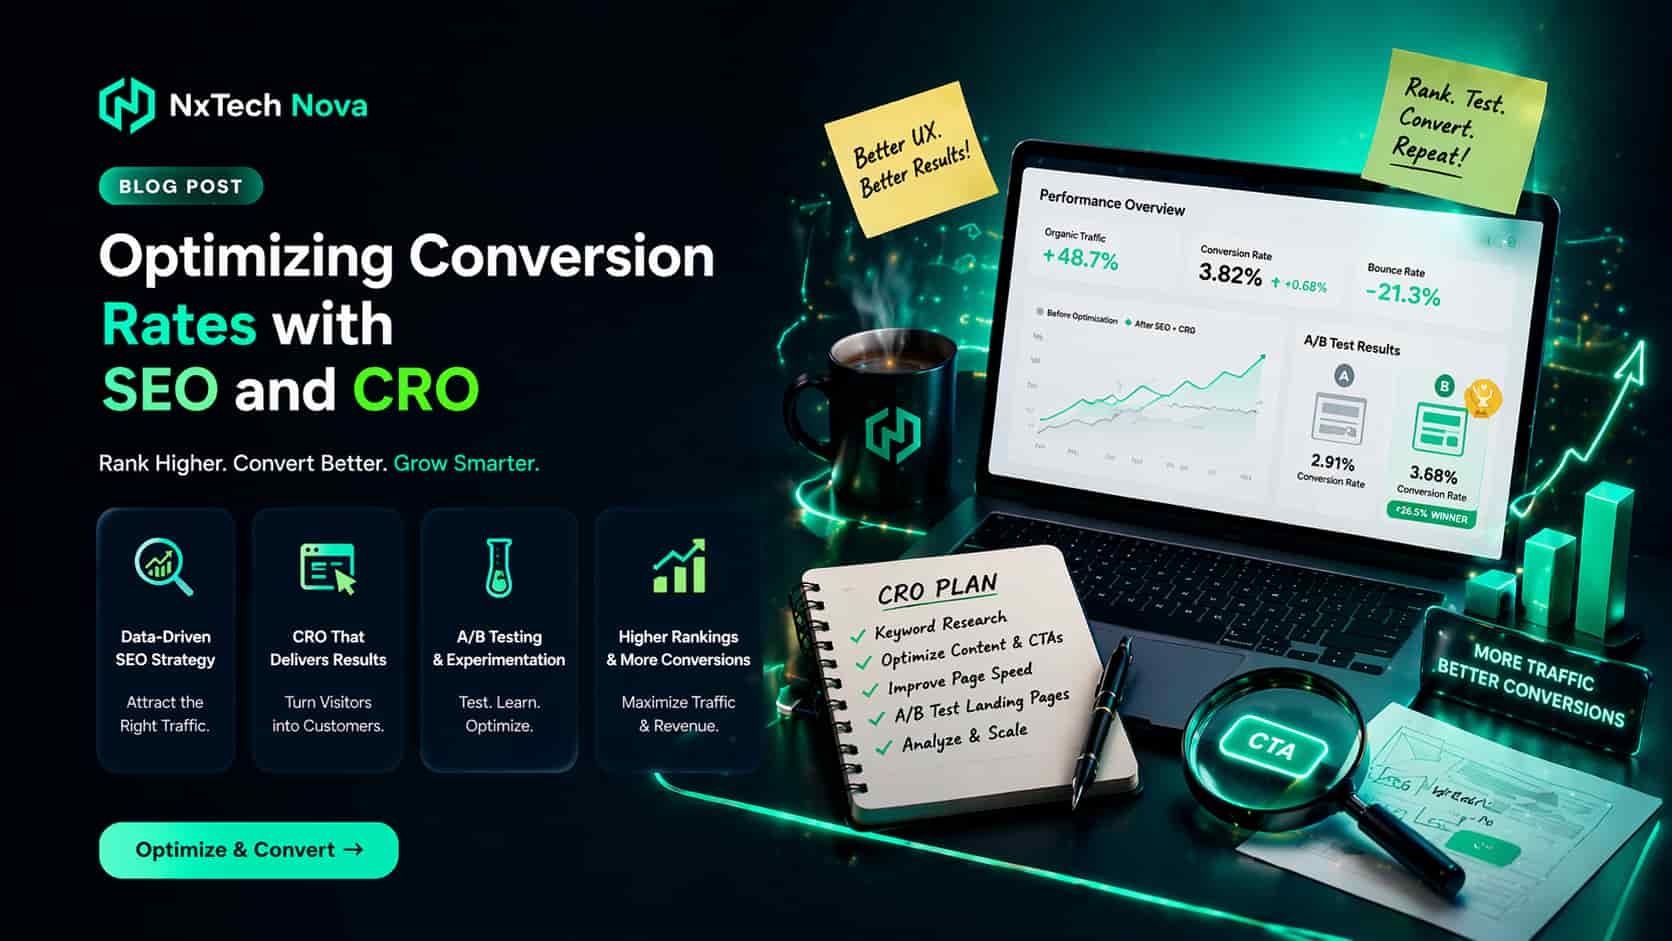
How to interpret SEO metrics to make better strategic decisions?
SEO metrics become useful only when you interpret them in combination.
Looking at one number in isolation causes bad decisions. A ranking increase can look positive while clicks fall. Traffic can grow while revenue stays flat. CTR can improve while the wrong pages absorb the gains.
The job is not to admire numbers. The job is to understand what the numbers mean.
Start with search visibility, then move to business value
Google Search Console’s Performance report shows clicks, impressions, CTR, and average position. Google also notes that average position is based on the topmost result from your site, and aggregation methods can change how those numbers look at property level.
That means visibility data is valuable, but it has to be read carefully.
A practical interpretation framework looks like this.
High impressions, low CTR
This usually means one of three things.
-
Your page is visible but the title and description are weak
-
The search intent is mismatched
-
Competitors are presenting a more attractive result
Strategic response:
Refresh titles, improve relevance, rewrite descriptions, and make sure the page truly answers the query.
Rising CTR, flat conversions
This means your search listing is doing its job, but the page experience or offer may not be.
Strategic response:
Review landing page clarity, call to action placement, trust signals, mobile usability, and internal journey.
Better rankings, lower clicks
This can happen when search demand itself falls, when query mix changes, or when the metric is being viewed too broadly at property level.
Strategic response:
Check impressions first. If impressions fell, the issue may be demand, seasonality, or lost query coverage. If impressions stayed strong, check whether the pages ranking are the right pages.
Strong traffic, weak engagement
A page that attracts search visits but loses users quickly is often ranking for the wrong intent or delivering shallow content.
Strategic response:
Rewrite the page around the user’s real question. Add clearer structure, examples, comparison content, and next steps. This is where content marketing and SEO should work together, not as separate teams, but as one system.
Good engagement, weak key events
This is a common sign that the content is helpful but the conversion path is weak.
Strategic response:
Improve offer alignment. Add stronger context, internal linking, better call to action placement, and clearer transitions between information and action.
This is also where many companies begin looking for seo services near me, not because rankings are the only goal, but because interpretation without action does not move the business.
Always check for reporting mistakes before assuming SEO failed
Google’s own troubleshooting guidance notes that one common reason for an apparent traffic drop is simply using the wrong Search Console property definition, such as mixing up http and https.
That lesson matters beyond property setup. Before reacting to an SEO dip, verify:
-
Tracking is still correct
-
The right property is selected
-
Key pages are indexed
-
There were no site changes that affected templates, canonicals, or redirects
-
The drop is not isolated to one device, country, or page type
Strategy comes from patterns, not panic
The best SEO decisions come from trend reading, not emotional reaction to one chart.
Look for patterns over time.
-
Which topics are gaining impressions
-
Which pages are under clicking expectations
-
Which pages attract non branded demand
-
Which landing pages actually produce leads or revenue
-
Which technical issues are slowing progress
When you interpret SEO this way, you stop chasing vanity metrics and start building a search strategy that supports growth.
What are the high-level metrics of SEO you should be tracking?
If you want one clean answer, here it is.
Track the metrics that show visibility, traffic quality, technical health, and business outcome. Ignore numbers that look impressive but do not change decisions.
A strong high level SEO view usually includes the following.
1. Impressions
Impressions show how often your site appears in search results. They are one of the earliest signals that visibility is growing, even before clicks rise. Search Console includes impressions directly in the Performance report.
Why it matters:
Growing impressions often mean Google is showing your content for more queries or broader variations of the same topic.
2. Clicks
Clicks show how often searchers choose your result. Search Console tracks this directly.
Why it matters:
Clicks show whether your search visibility is translating into traffic.
3. Click through rate
CTR is clicks divided by impressions. Search Console and Google Ads both use this logic in their own contexts.
Why it matters:
CTR helps you judge how compelling your search appearance is. If impressions are rising but CTR is weak, your snippet, relevance, or positioning may need work.
4. Average position
Average position gives directional insight into where your site tends to appear. It should never be treated like the only success metric, but it helps explain visibility changes. Google notes that this metric reflects the topmost result from your site and can look different depending on aggregation.
Why it matters:
Position helps explain whether low clicks come from weak ranking or weak CTR.
5. Organic sessions and users
This is where Google Analytics comes in. Search Console tells you what happened in search results. Analytics tells you how much traffic organic search actually delivered and how users behaved after arriving.
Why it matters:
Traffic tells you whether visibility is producing real site visits.
6. Engaged sessions from organic traffic
An engaged session in Google Analytics is based on time, key events, or multiple views. Google defines it clearly, which makes engagement rate a more useful quality metric than raw visits alone.
Why it matters:
This helps separate empty traffic from traffic that is actually interested.
7. Key events or conversions from organic search
Whether your goal is lead generation, purchases, signups, or calls, this is where SEO connects to business value. Google Analytics now treats key events as the important actions businesses want to monitor.
Why it matters:
A search strategy that increases traffic but not outcomes is incomplete.
8. Landing page performance
Google Analytics has dedicated landing page reporting that helps you see the first page users arrive on and how many visitors land on each page.
Why it matters:
SEO growth usually happens page by page, not site wide all at once. Landing page analysis tells you exactly where to improve.
9. Indexed pages and indexing issues
The Search Console Page indexing report shows the indexing status of URLs Google knows about, including reasons pages were not indexed. The URL Inspection tool helps check a specific page’s indexed version and whether a live URL appears indexable.
Why it matters:
Great content cannot rank if Google cannot index it properly.
10. Core Web Vitals
Search Console’s Core Web Vitals report uses real world usage data and groups pages by status across LCP, INP, and CLS.
Why it matters:
Speed and page experience affect both user satisfaction and your ability to convert the traffic SEO wins for you.
11. Branded versus non branded performance
This is not a default headline metric, but it is strategically important.
Why it matters:
Branded growth often shows rising brand demand. Non branded growth shows your ability to capture new demand. Healthy SEO needs both, but most growth strategies depend more heavily on non branded opportunity.
12. Revenue or lead quality from organic search
This is the metric many teams skip and later regret.
Why it matters:
The real goal is not traffic. It is commercially useful traffic.
A simple executive SEO dashboard
If you want a clean leadership view, keep it focused on these categories.
-
VisibilityImpressions, clicks, CTR, average position
-
Traffic qualityOrganic sessions, engaged sessions, landing page engagement
-
Business outcomesKey events, leads, pipeline value, revenue from organic
-
Technical healthIndexed pages, Core Web Vitals status, page level issues
-
Content opportunityPages with high impressions and low CTR, pages with traffic but low conversion, pages close to page one improvement
This is also where advanced content marketing becomes a natural extension of SEO. Once the metrics reveal where demand exists, content is what helps you capture more of it, satisfy intent better, and move users from searcher to customer.
Conclusion
Good marketing decisions do not come from more charts. They come from better interpretation.
AI helps brands process complexity faster. Google Analytics helps measure what users actually do. Search Console shows how your site performs in search. SEO metrics reveal where visibility, quality, and revenue are growing or slipping. PPC data adds immediate demand signals. When these systems are read together, brands stop reacting to isolated numbers and start making smarter strategic choices.
That is what data driven decision making should feel like. Clearer. Faster. More confident.
If your business is sitting on plenty of data but still struggling to turn that data into SEO growth, stronger reporting, better paid performance, and sharper decisions, the next smart step is not another disconnected tool. It is a better system.
And if you want help building that system in a way that connects analytics, strategy, and execution, start by exploring best digital marketing agency near me options that can actually tie AI insight, SEO, PPC, and content into one measurable growth plan.